
Security is not a module. It is built into every environment.
Every Core environment watches itself: who can get in, what changes and whether anything looks off. You do not have to switch anything on, and you see all of it.
Security alerts
-
Signed in from a new IP addressEmail straight to the account holder, 09:14
-
Two-factor setting changedConfirmation by email, 11:02
-
Sign-in attempts blocked after 5 failuresTemporary lockout, automatic, 13:47
What every environment does by default
No settings you can forget to switch on. This is active from day one.
You hear about it straight away
Core emails you automatically when something sensitive happens to your account: a sign-in from a new location, a change to your two-factor settings or a new password.
Everything traceable
Sensitive administrative actions are recorded in an audit log kept for 7 years, accessible only with the right permissions. Request logs are kept for 2 weeks by default, configurable per environment.
Access that fits the job
Roles and permissions per user, with two-factor authentication through an authenticator app (TOTP) or SMS. People see only what their work requires.
Attacks stop themselves
Five failed sign-in attempts trigger a temporary lockout, and persistent attempts an IP ban. Requests carrying attack signatures (injection, scanners, probes) earn an immediate 30-day ban. Trusted IP addresses go on an allowlist.
Encrypted, always
All data is encrypted at rest. Files and fields are encrypted with AES up to 256-bit, passwords are hashed with PBKDF2-SHA512 at 200,000 iterations. The full cluster is backed up every hour to separate storage.
Updates without gaps
Security patches are rolled out automatically by the platform. No maintenance window, no environment left behind.
You see what we see
Security you cannot verify is a promise, not a fact. So as an administrator you see for yourself what happens in your environment: the logs, the blocks and the way they are managed.
- Request logs with traffic insight per environment
- View and lift IP bans, manage the allowlist yourself
- Metrics endpoints for your own monitoring stack
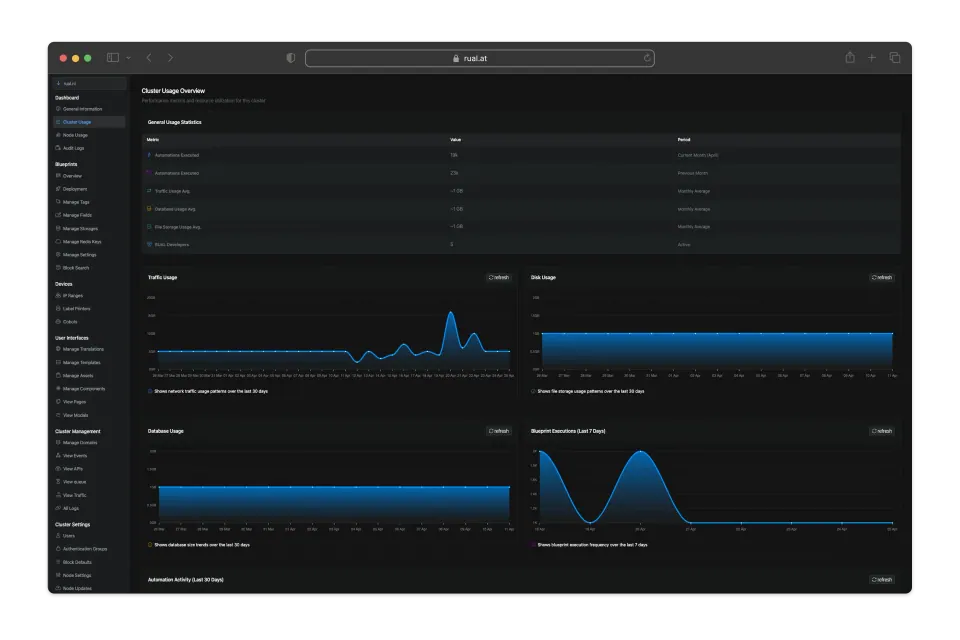
Every request is seen
Active threat protection runs underneath every environment. All traffic is logged and monitored, and the cluster intervenes on its own when it spots an attack pattern. A ban on one node applies across the whole cluster immediately.
- Every API request logged: method, path, IP, user, status, timing and origin. Sensitive values are masked before storage.
- Automatic IP ban on brute force and attack patterns: injection, scanners and probes get 30 days on the spot.
- Cluster audit log: who viewed a secret, who created users, who lifted a ban. Kept for 7 years.
- Live metrics per environment (CPU, memory, requests, latency, errors) through secured Prometheus-compatible endpoints, for your own monitoring too.
Cluster monitoring
- CPU
- 23%
- MEMORY
- 41%
- REQUESTS/S
- 1,284
- 14:02:11 api.request · /orders · 200 · logged
- 14:02:09 audit · secure setting viewed by administrator
- 14:01:52 threat · scanner signature detected in request
- 14:01:52 auto-ban · IP blocked for 30 days
The foundation: Dutch data centres, European law
Everything above runs on our own hardware in ISO-certified data centres in Ede. Fully European, so no US CLOUD Act.
Want to know what this looks like for your environment?
We are happy to show it live, with your questions on the table. Found something yourself? See our responsible disclosure.